Sports Reference
Year-in-Review Campaign
Showcasing Sports Reference user data over the course of one year through engaging social, web, and email campaigns.

Team
Matt Severino, Maggie Walsh-Deaver, Jonah Gardner, Ryan Walsh, Kyle Brown, Sam Lavallee
Skills
Research, Content Strategy, Data Analysis, Social Media
Timeline
June 2024 - August 2024
Overview
Goals
Research
Social Media Audit
Proposal


My team was tasked with the development of an engaging, shareable way of promoting Sports Reference data for a “year-in-review” style campaign.
Our five main goals for this campaign were:
Understand the types of data-driven content that fans engage with
Tell a story with the data
Create assets that encourage shares
Increase reach and impressions to drive brand awareness
Drive users down the “rabbit hole” – encourage link clicks and several more page views
First, we conducted extensive research on existing year-in-review campaigns. We noted elements that we think would translate well to Sports Reference data and kept a log of the companies/posts we were visiting. Companies like Letterboxd, Beli, and Cabify, as well as X accounts @Brooks_Gate and @JayCuda provided great inspiration. From there, we created a “pitch” document to present to the marketing team, including all of our research and preliminary suggestions for the campaign.

Based on those metrics, here were our main takeaways:
The campaign was shared in one carousel, leading to a one-day bump in engagement.
The map posts received at least 1.4x the impressions on the next-ranked post.
X
The campaigns were shared in a thread, leading to decreased visibility
Some posts were shared both in a thread and on their own
Impression count is fewer from each entire thread (7+ posts) than individual posts
Web
Images were sized for social and placed on a web page
No additional/varied content on this medium
We proposed a day-by-day release of the content, giving each unique asset its time to shine and make its way to our social following. By not hiding each piece within a thread, we open the doors to a new level of reach and engagement.
These are the final ideas we pitched for the campaign:
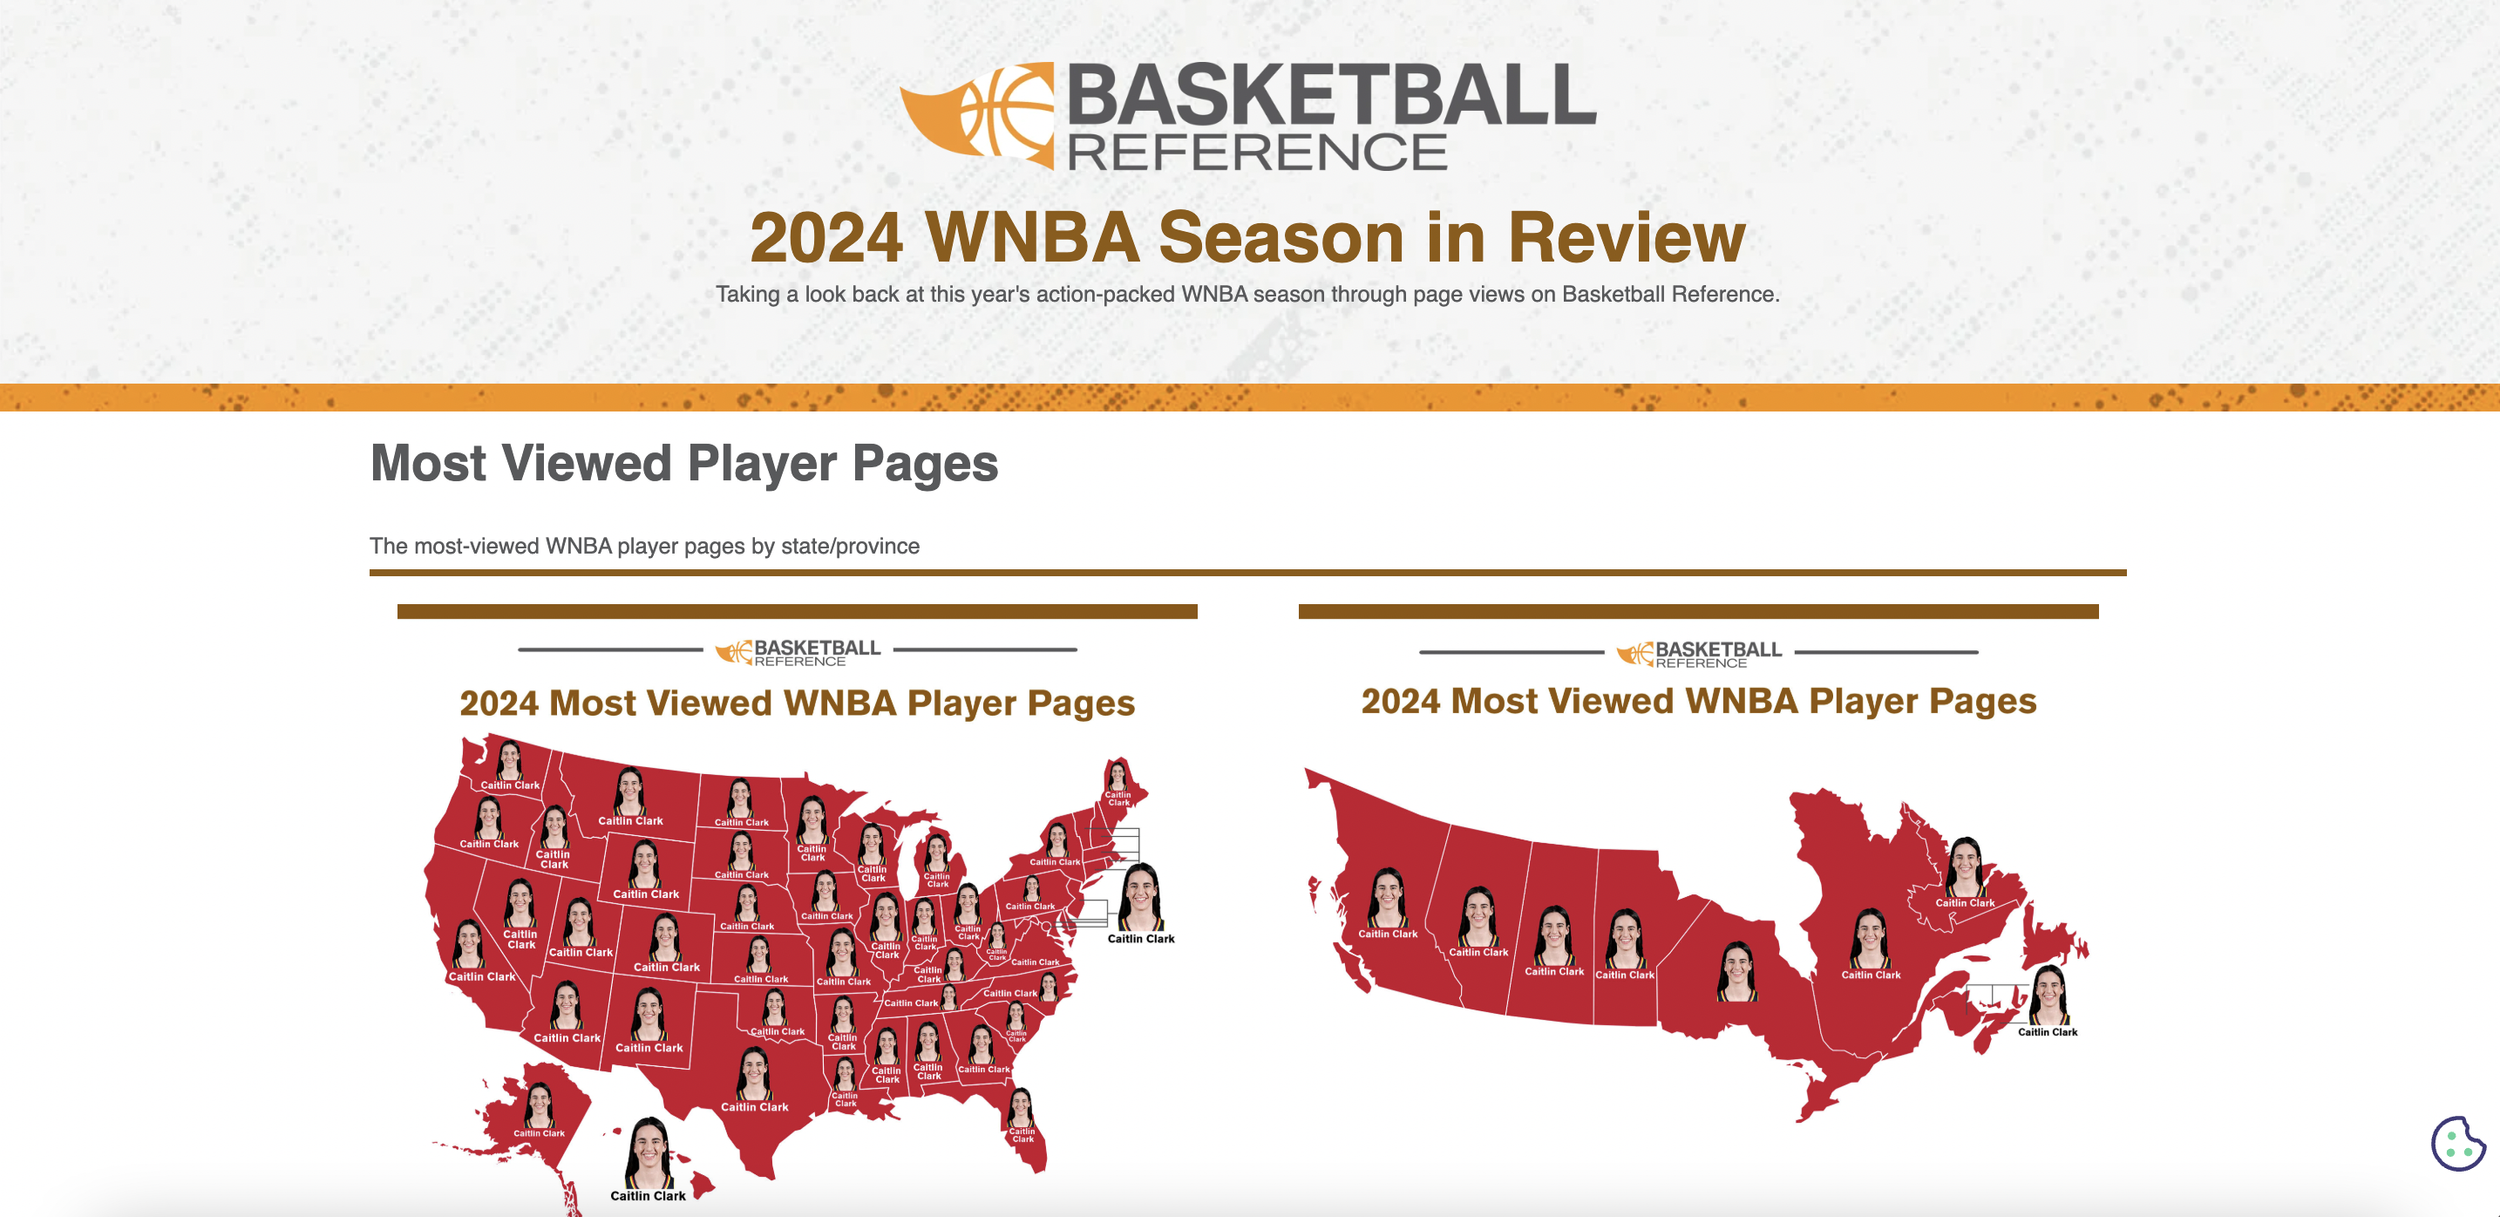
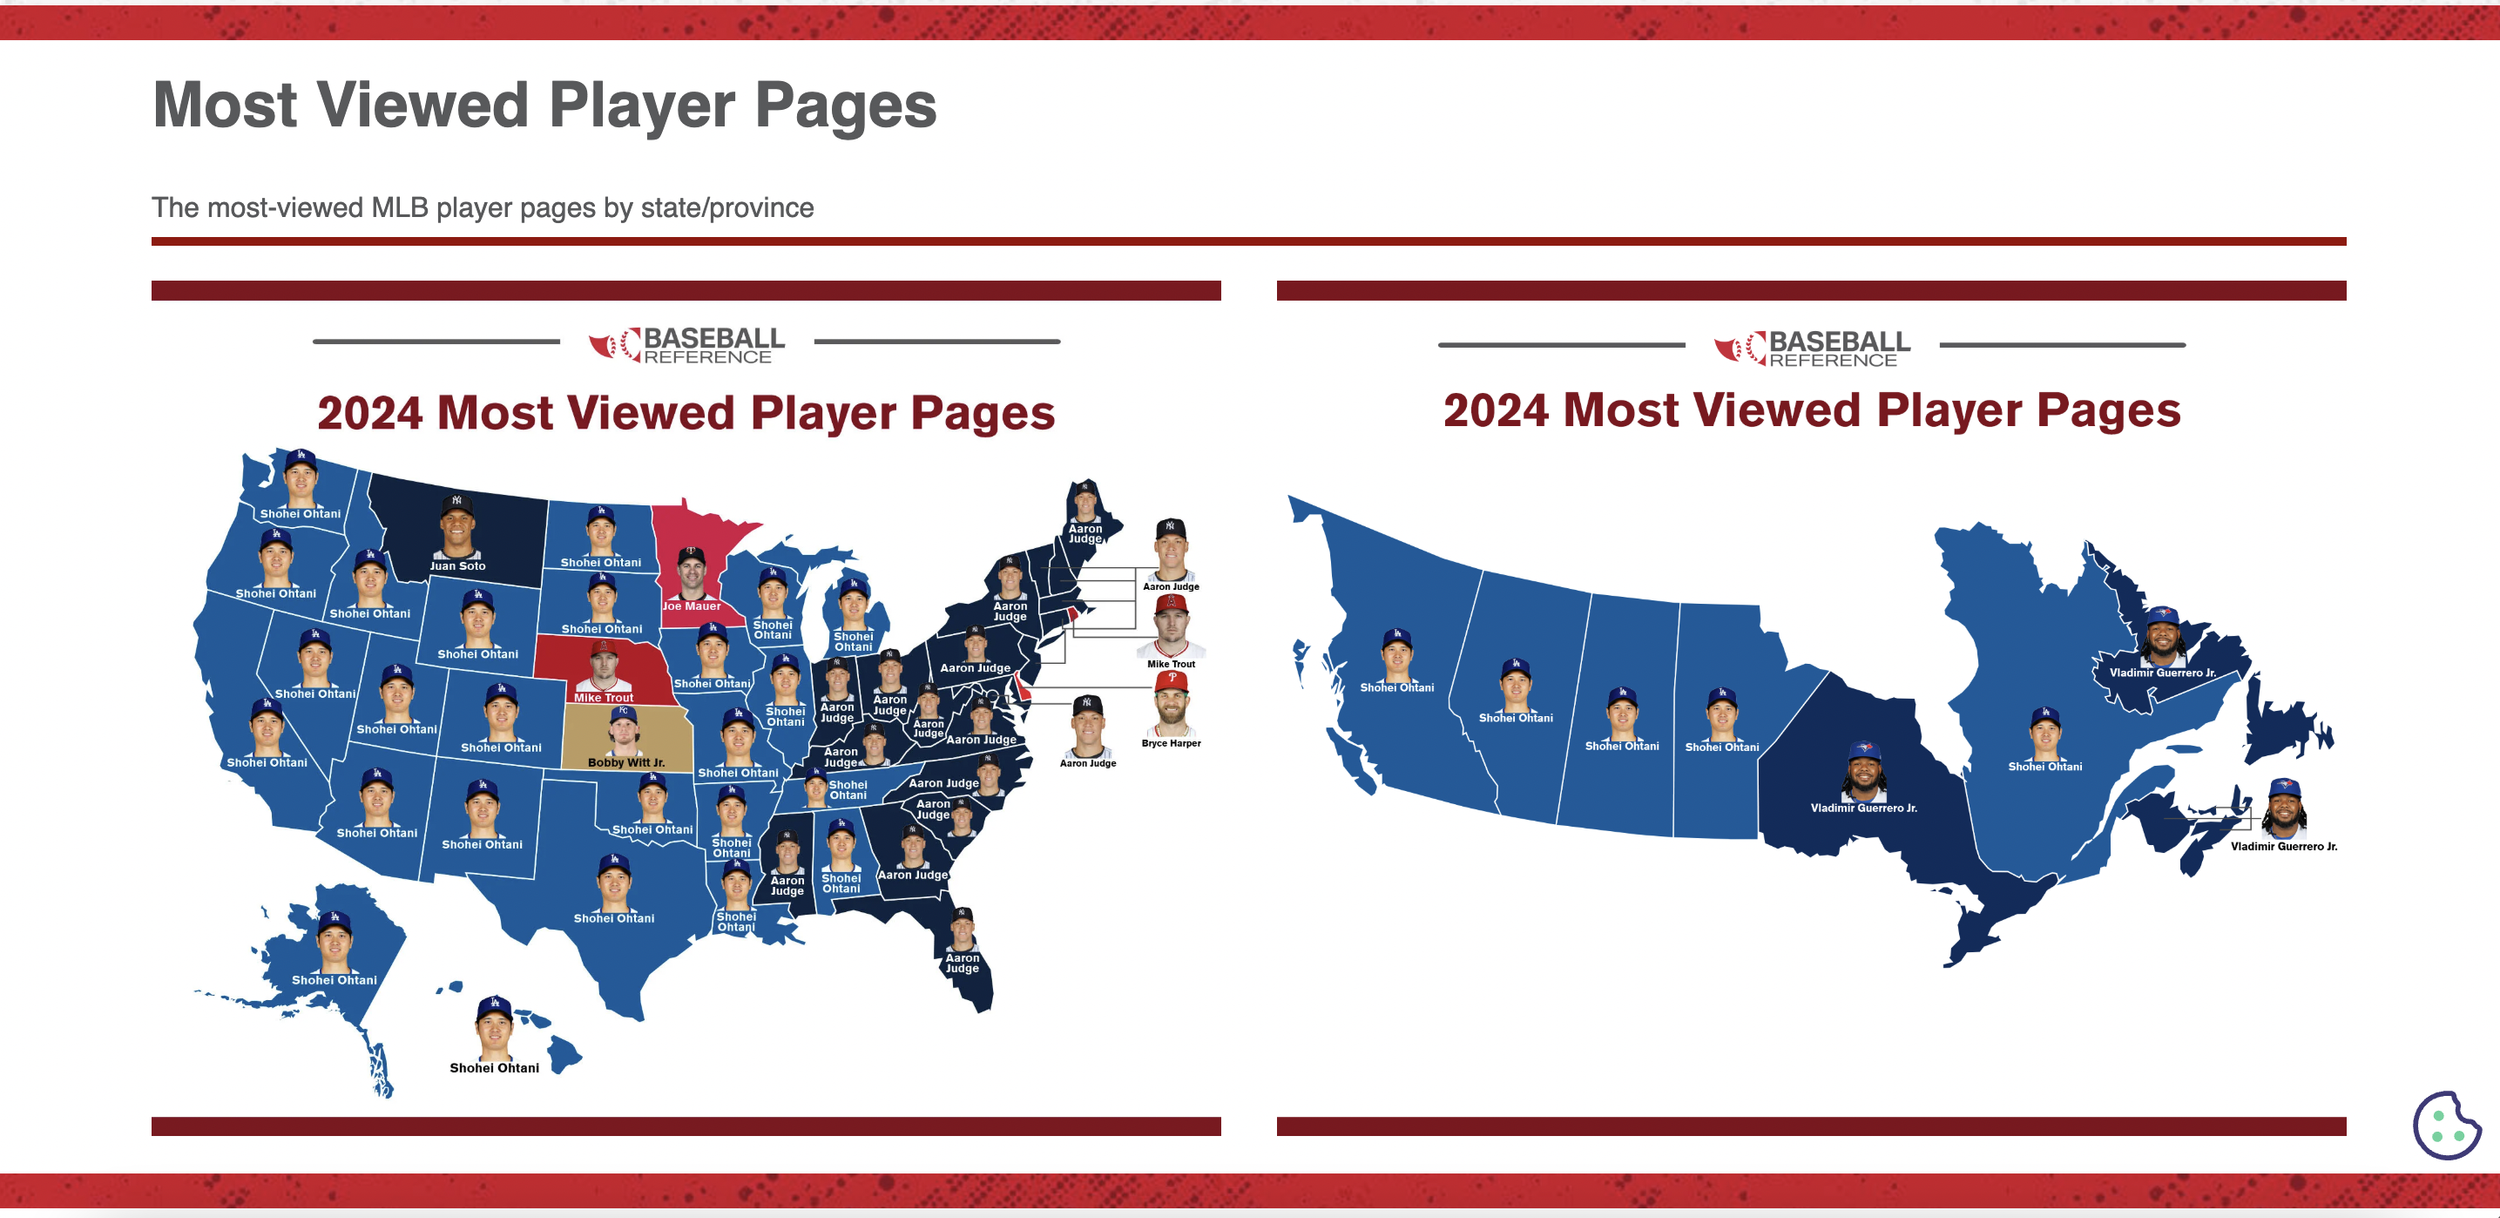
Player & team maps (with more countries than USA/Canada)
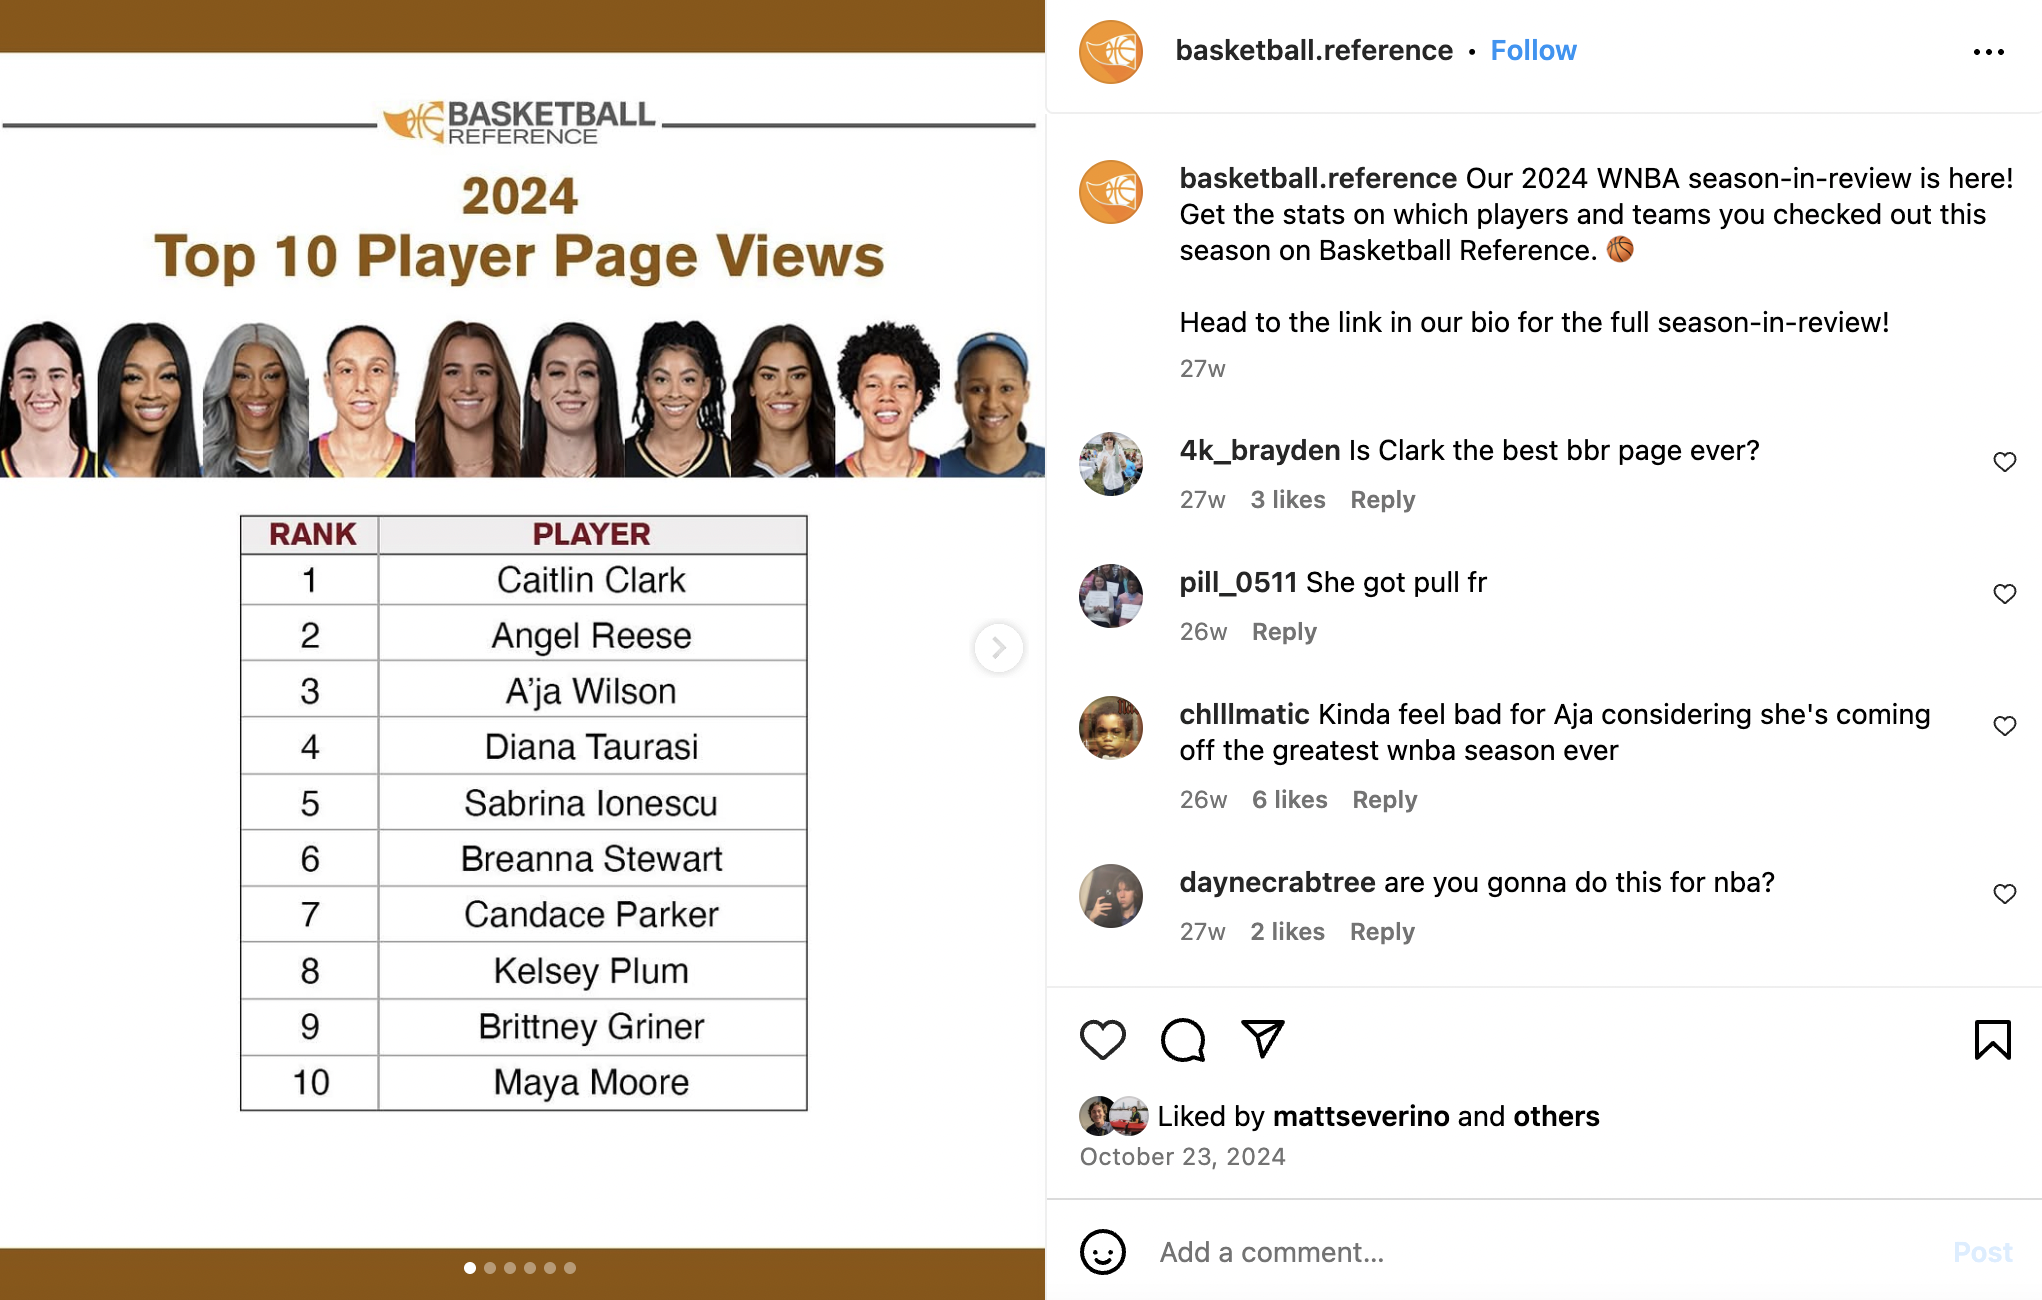
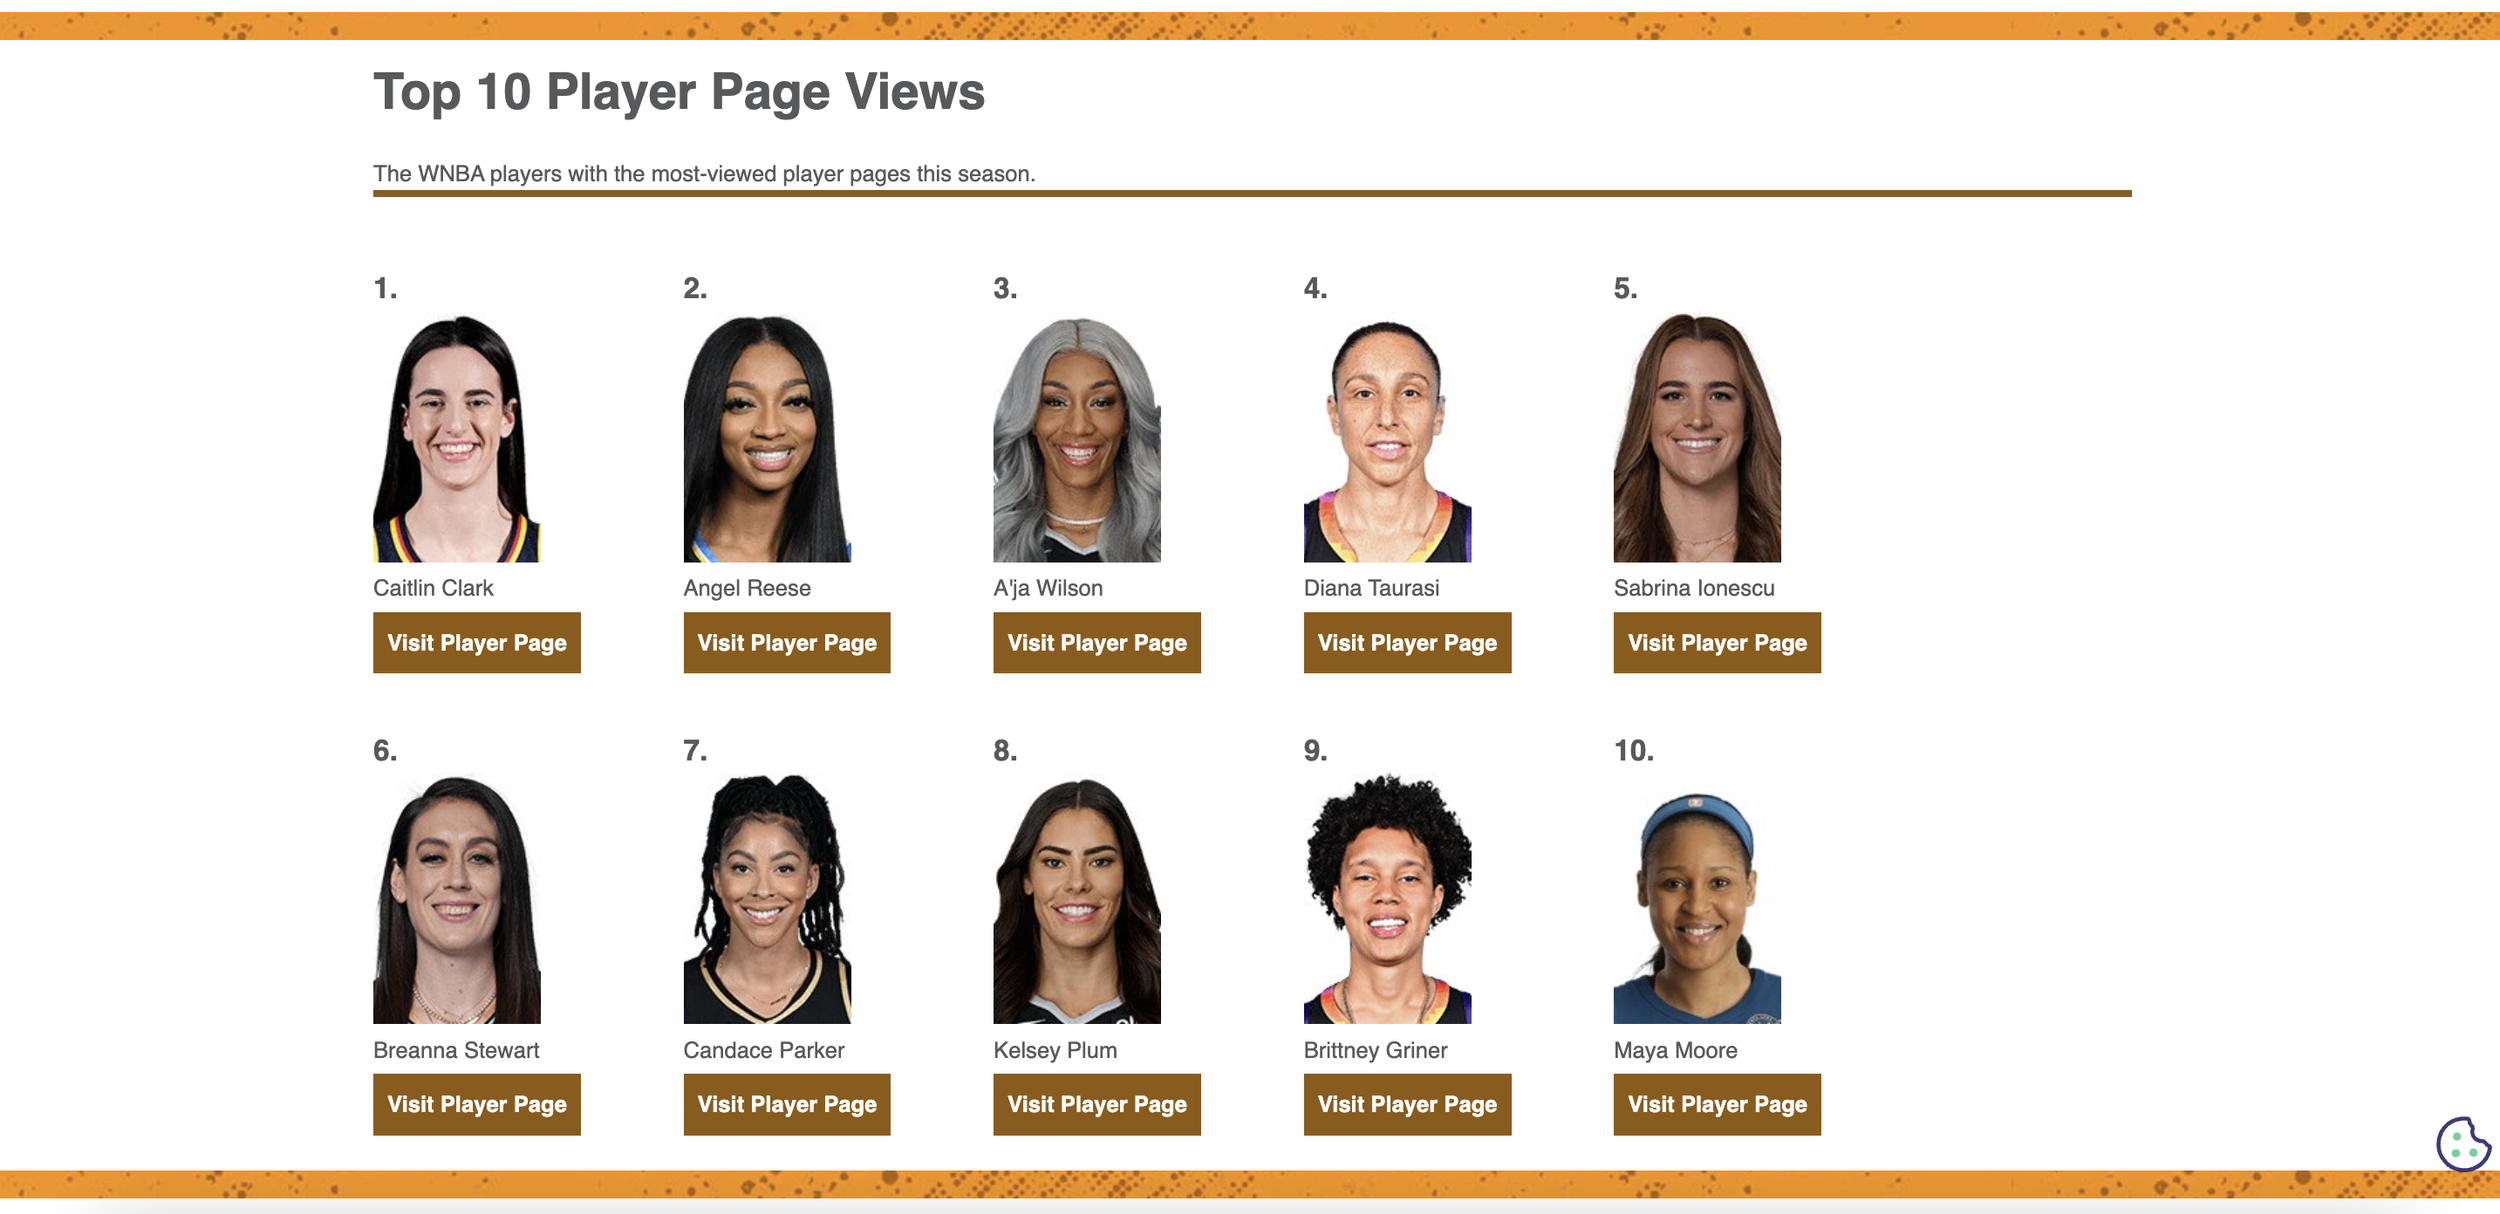
Top 10 players & teams
Increases & decreases in page views year-over-year
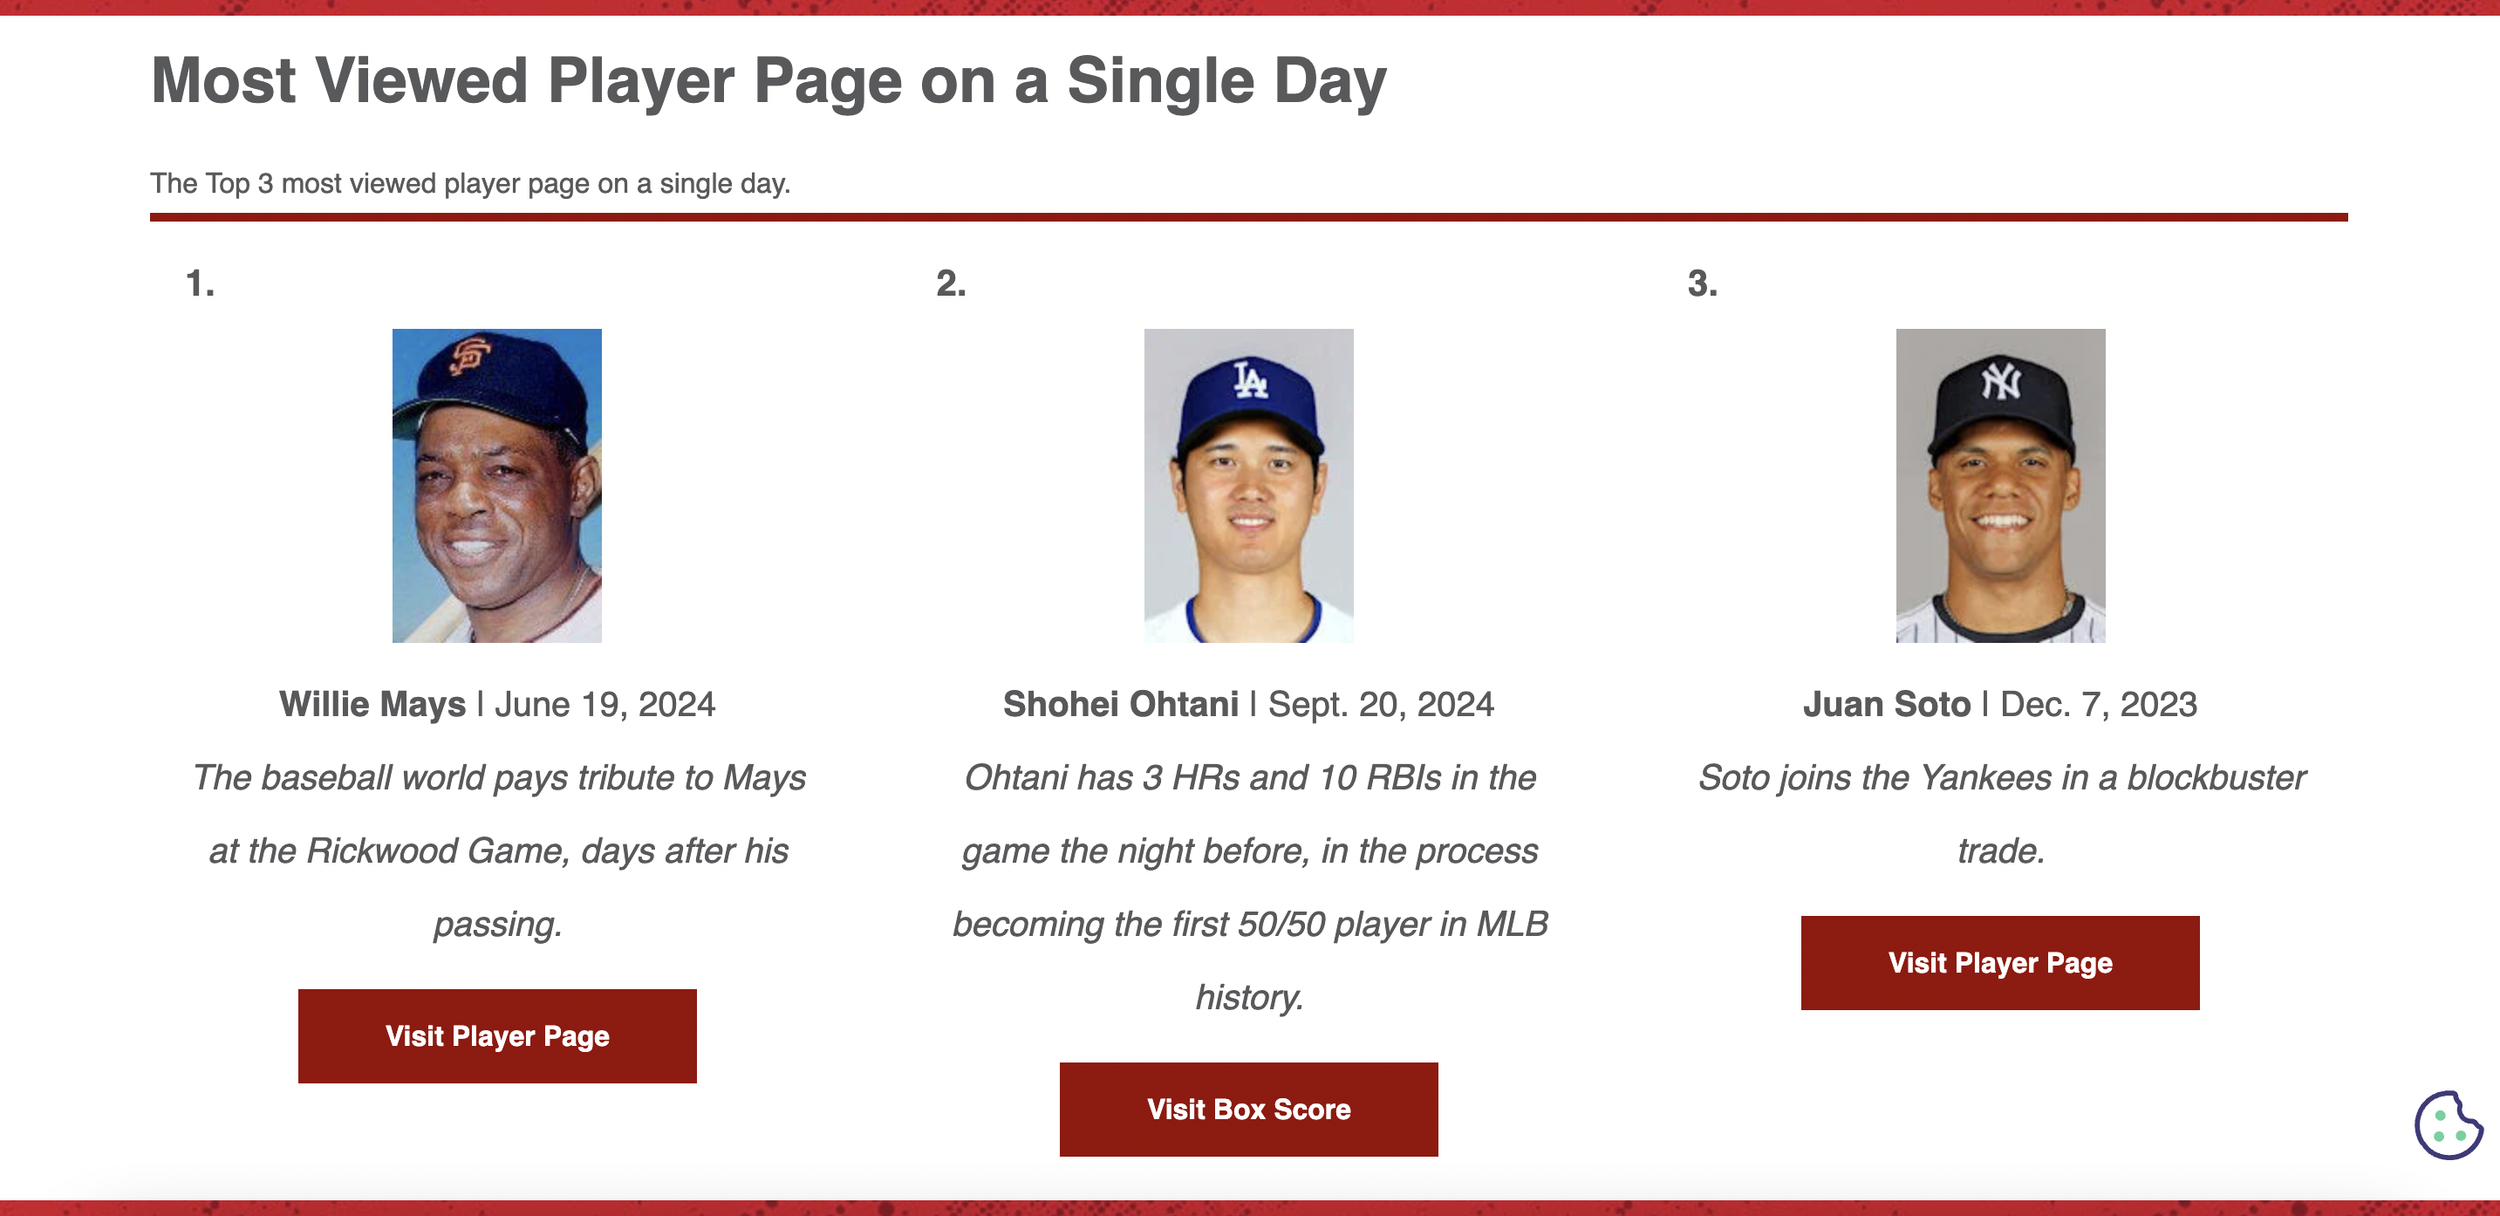
Most viewed player pages on a single day
Number of additions to the site
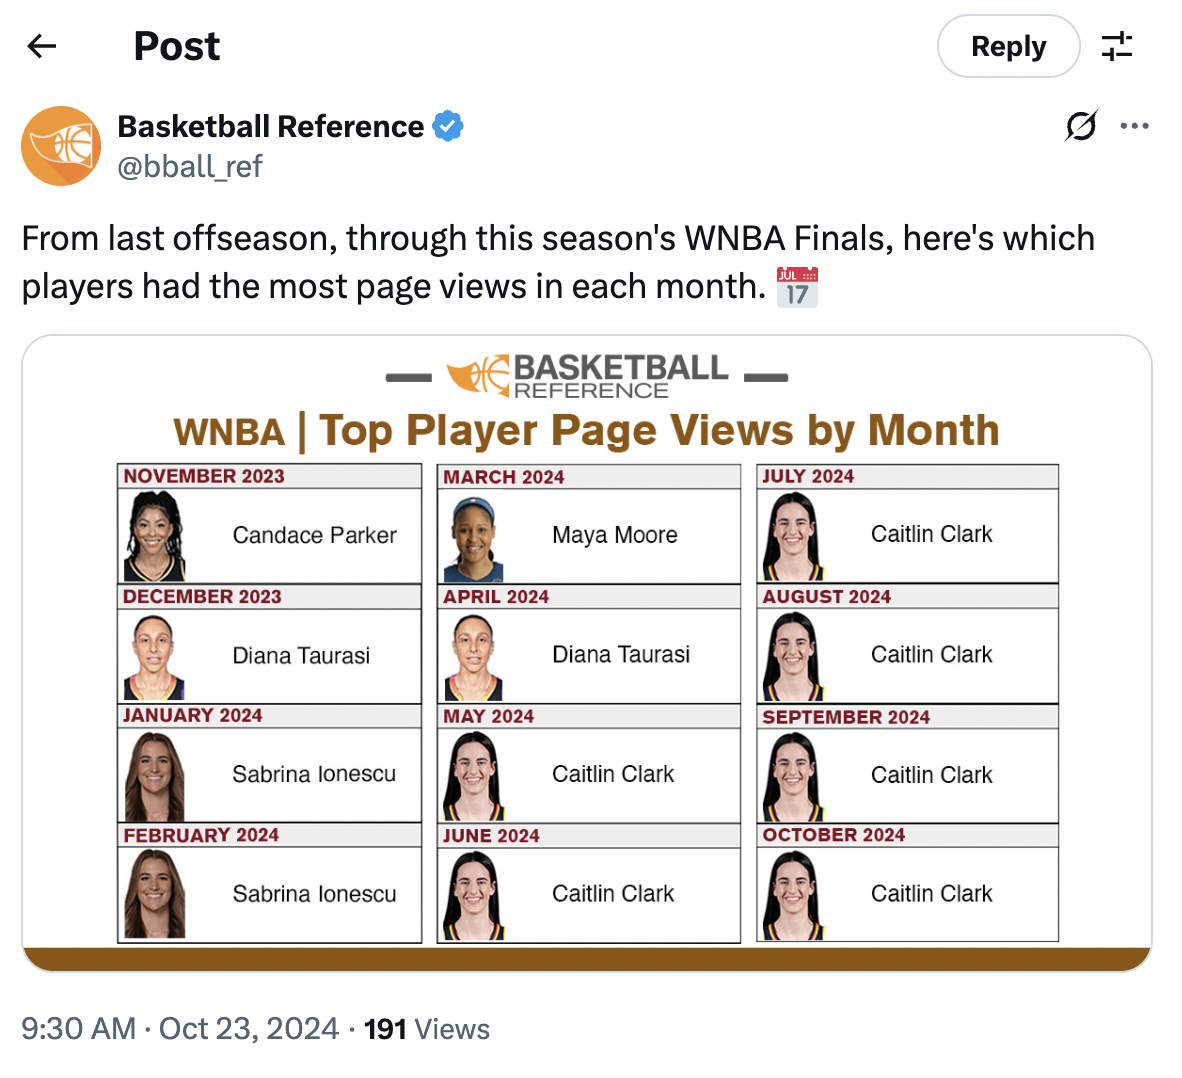
Month-by-month breakdown
Flashbacks
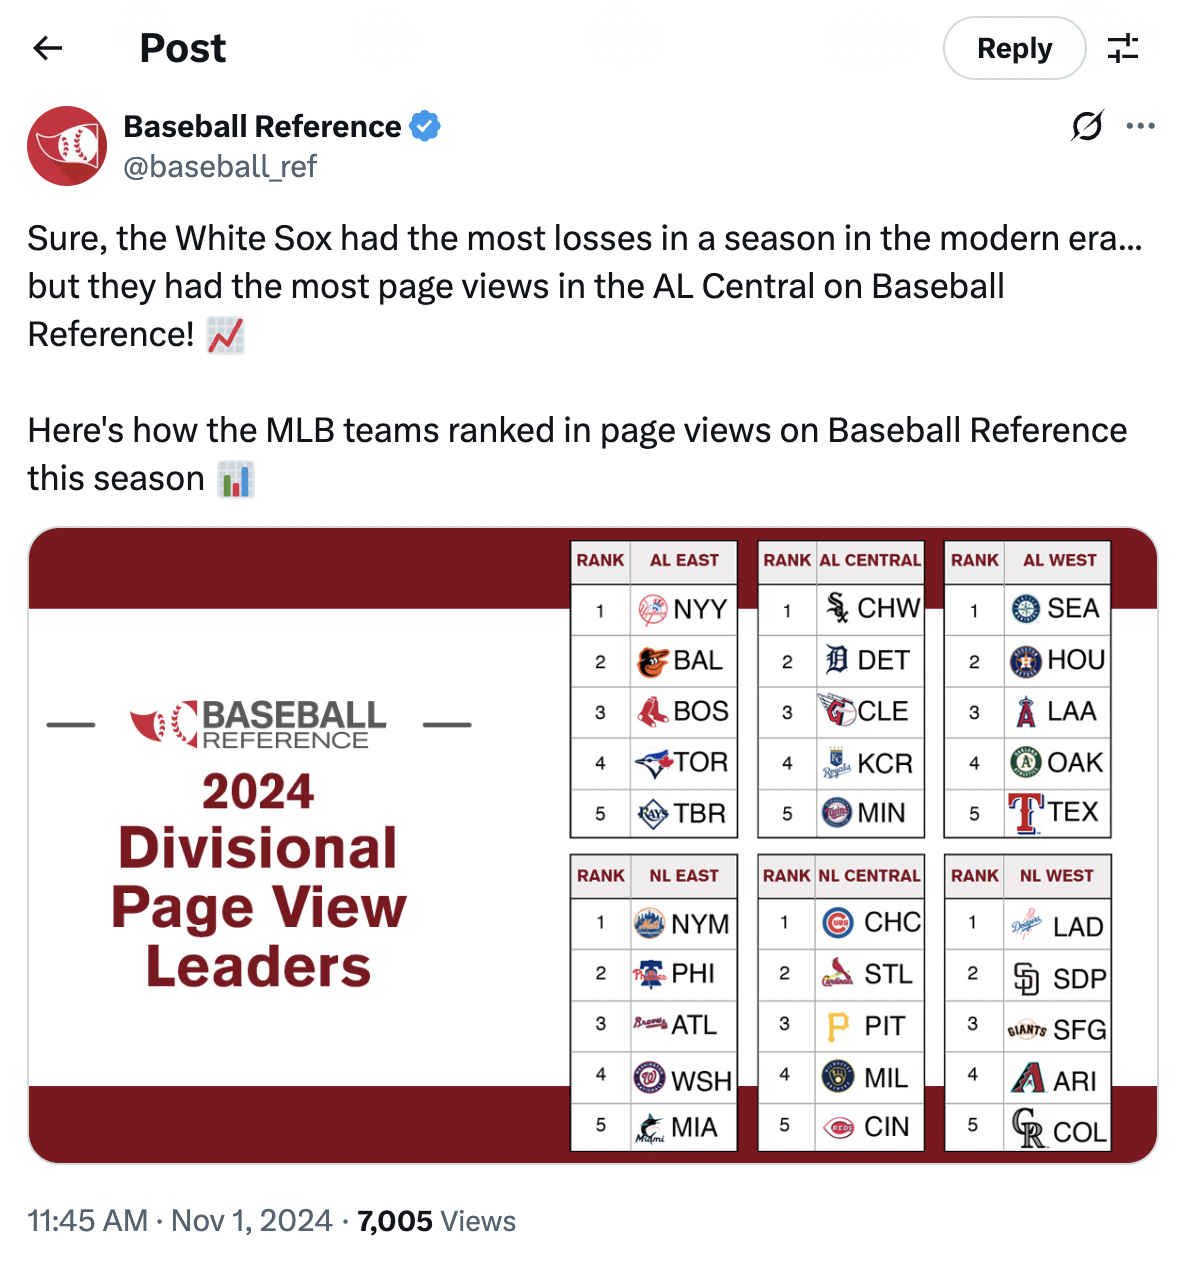
Divisional & league standings based on page views
Assembling teams by page views (positional leaders)
Ex. Baseball Reference first team page views)
It was also important to consider certain factors when rolling out this campaign, like time of year, time of day, oversaturation, and asset design. Posting at the end of the year would add just another “Spotify Wrapped” to users’ feeds, but if we posted each sport at the end of their season, we’d be posting this content year-round. Additionally, if we do a day-by-day rollout, we might be oversaturating the feed with one type of content (ex. several maps in one day). Lastly, the team agreed that the assets needed to be designed to look like our websites, so when people screenshot and post on their own (like they inevitably will), that it will be obvious where this data came from.
After careful consideration, the team decided on a seasonal rollout to keep our brand top of mind year-round. This would provide a constant stream of the year-in-review data consumers love when most other companies can only do it in November/December.
Campaign Rollout
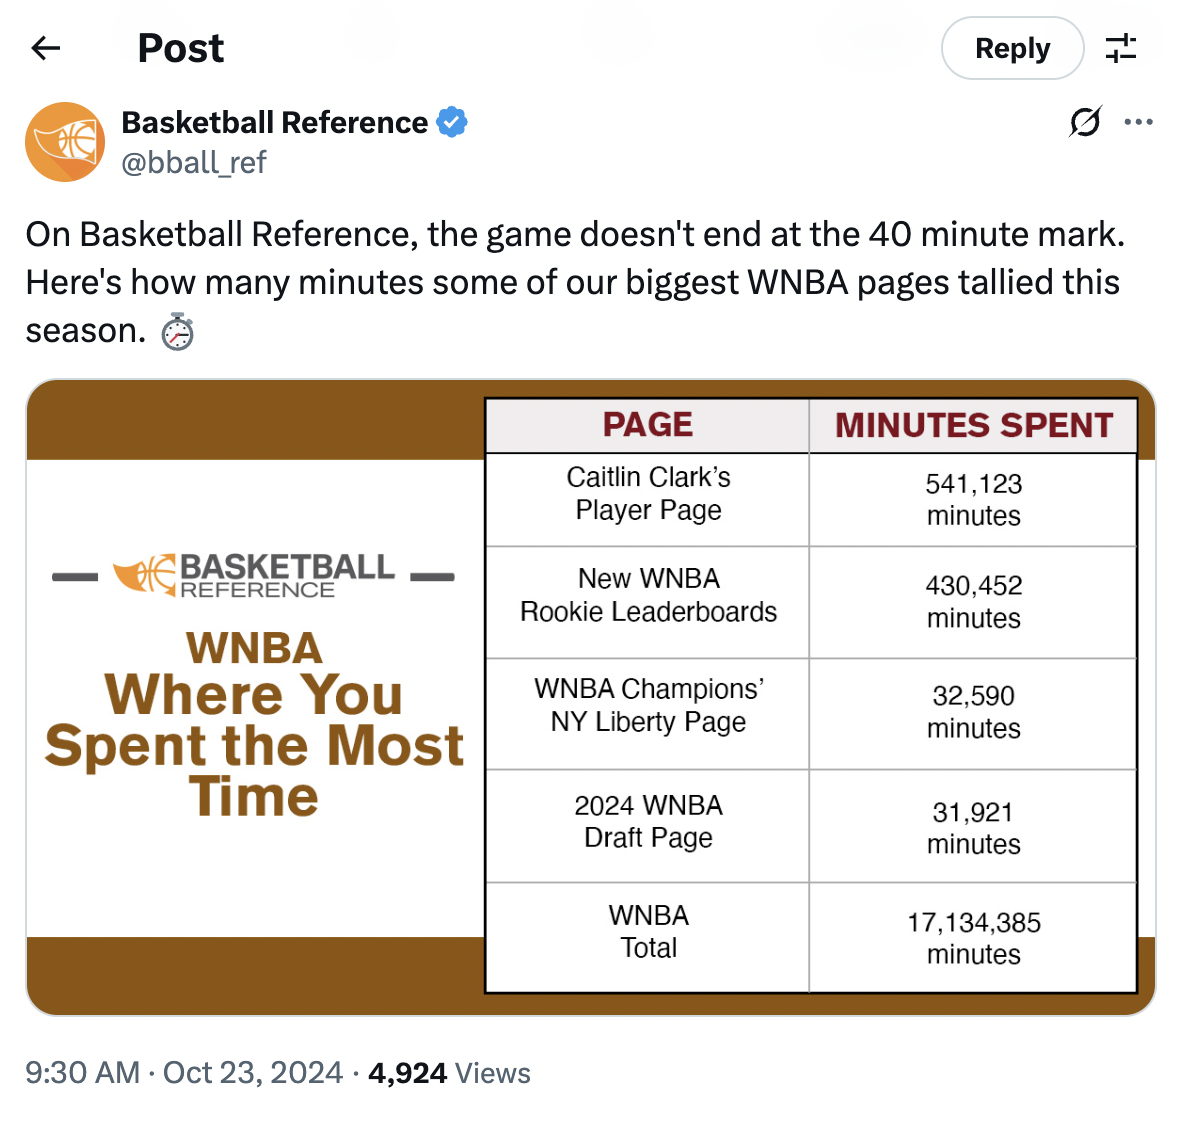
WNBA
The first sports season to end after our campaign was fully planned was the WNBA. After the New York Liberty won the WNBA title on October 20, 2024, the season-in-review went live on October 23rd.

MLB
The Los Angeles Dodgers won the World Series on October 30th, and the campaign went live on November 1st for Sports Reference’s most popular website, Baseball Reference.


In addition to the social media posts and landing page, the season-in-review was sent in an email blast to all users opted-in to each sport. When the season ended it was sent with the subject “✨⚾️Your 2024 MLB Season Recap is here,” and in December, another email with just the maps “✨⚾️Your 2024 MLB Maps are here.”
Since it’s been less than a full calendar year since we finalized the campaign, we have yet to see the full results from each sport. As of April 2025, between WNBA, MLB, NCAA Football, NFL, and NCAA Basketball (Men’s and Women’s), we’ve seen over
15 million impressions on social media since October of 2024.
These numbers will be updated after the 2024-2025 NBA and NHL seasons conclude.